See what
monitoring looks like in practice
The recording follows the whole path of the data: from a sensor reading on the structure, through the equation and the safety threshold, to the SMS to the on-call engineer and the report that explains what happened.
Six views in which the maintenance team works
Each of them answers a different question: what is happening, what has changed, what needs a response.
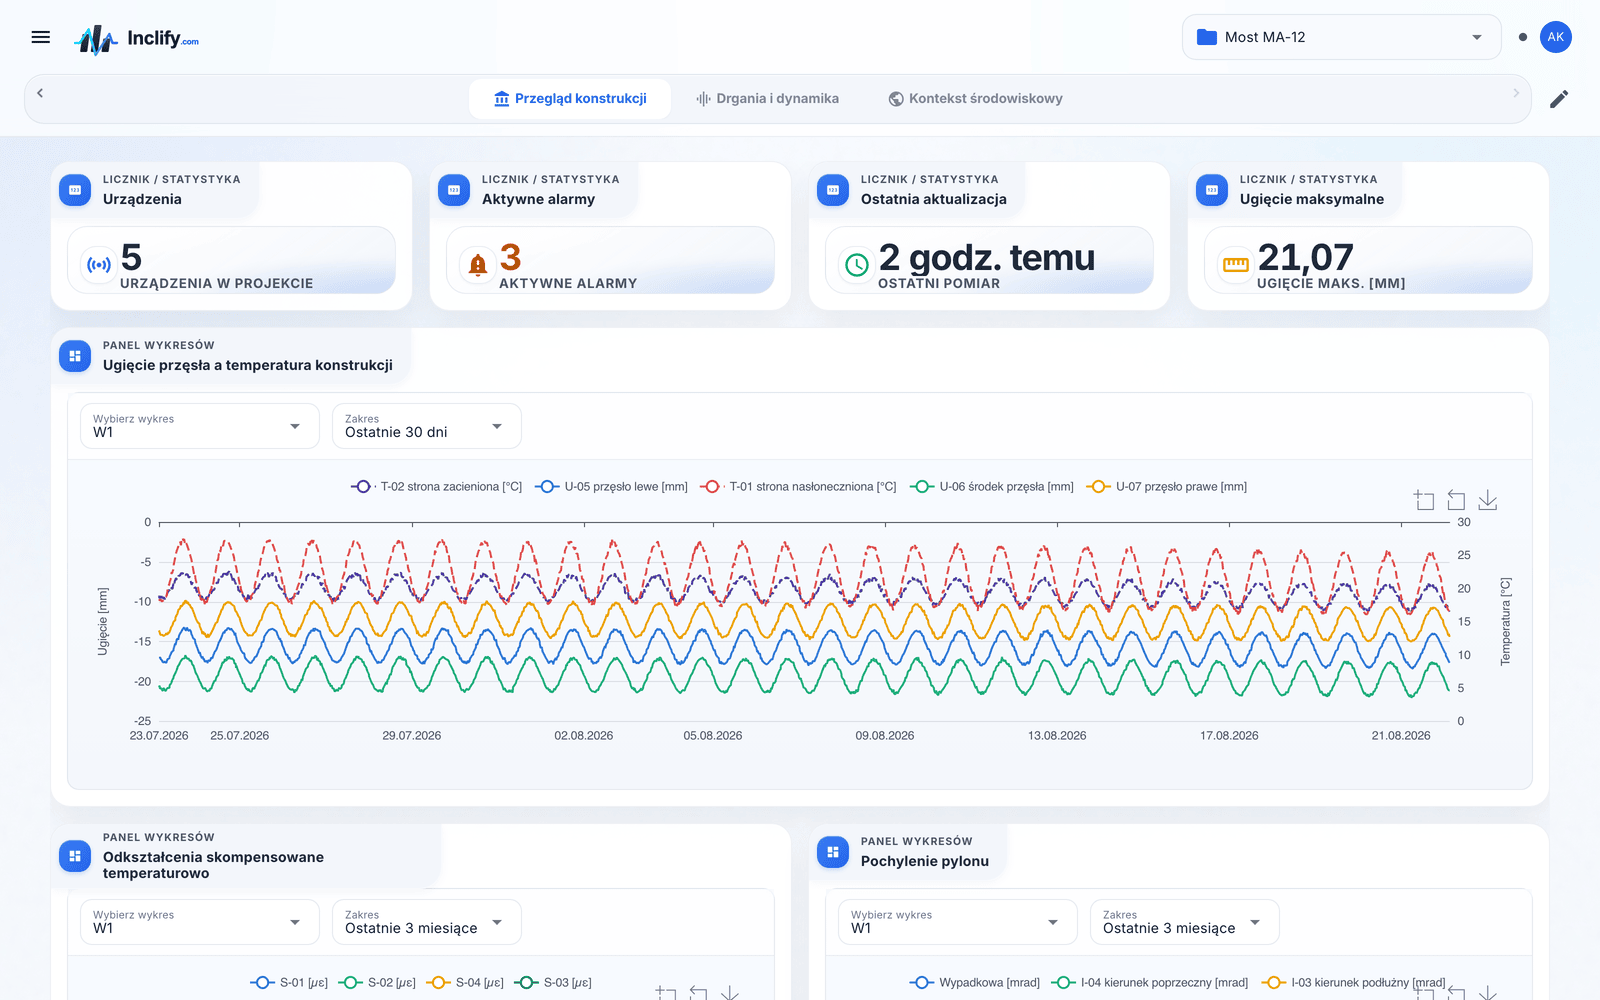
The whole structure on one screen
A dual-axis chart (deflection and temperature), KPI indicators, the alarm list and a table of the latest readings. You arrange the widget layout yourself, separately for desktop and for the phone.
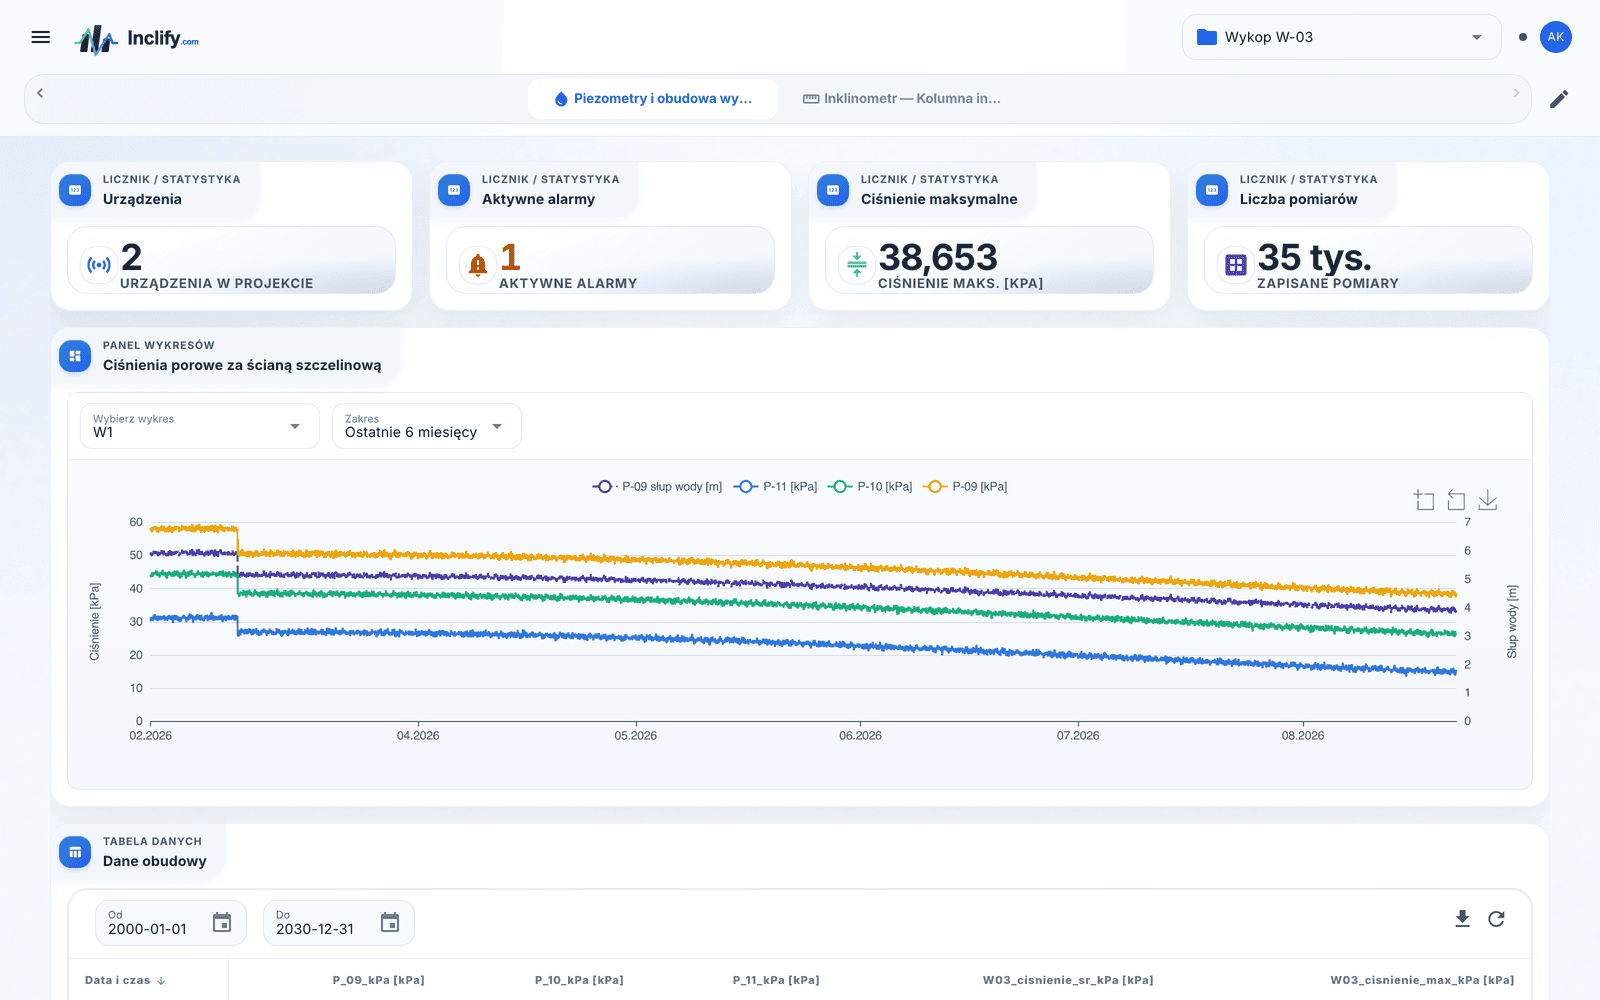
Displacement profile from the anchor
An inclinometer chain in an excavation: displacement at every depth, an A/B axis switch, the maximum deflection and the depth at which it occurred.
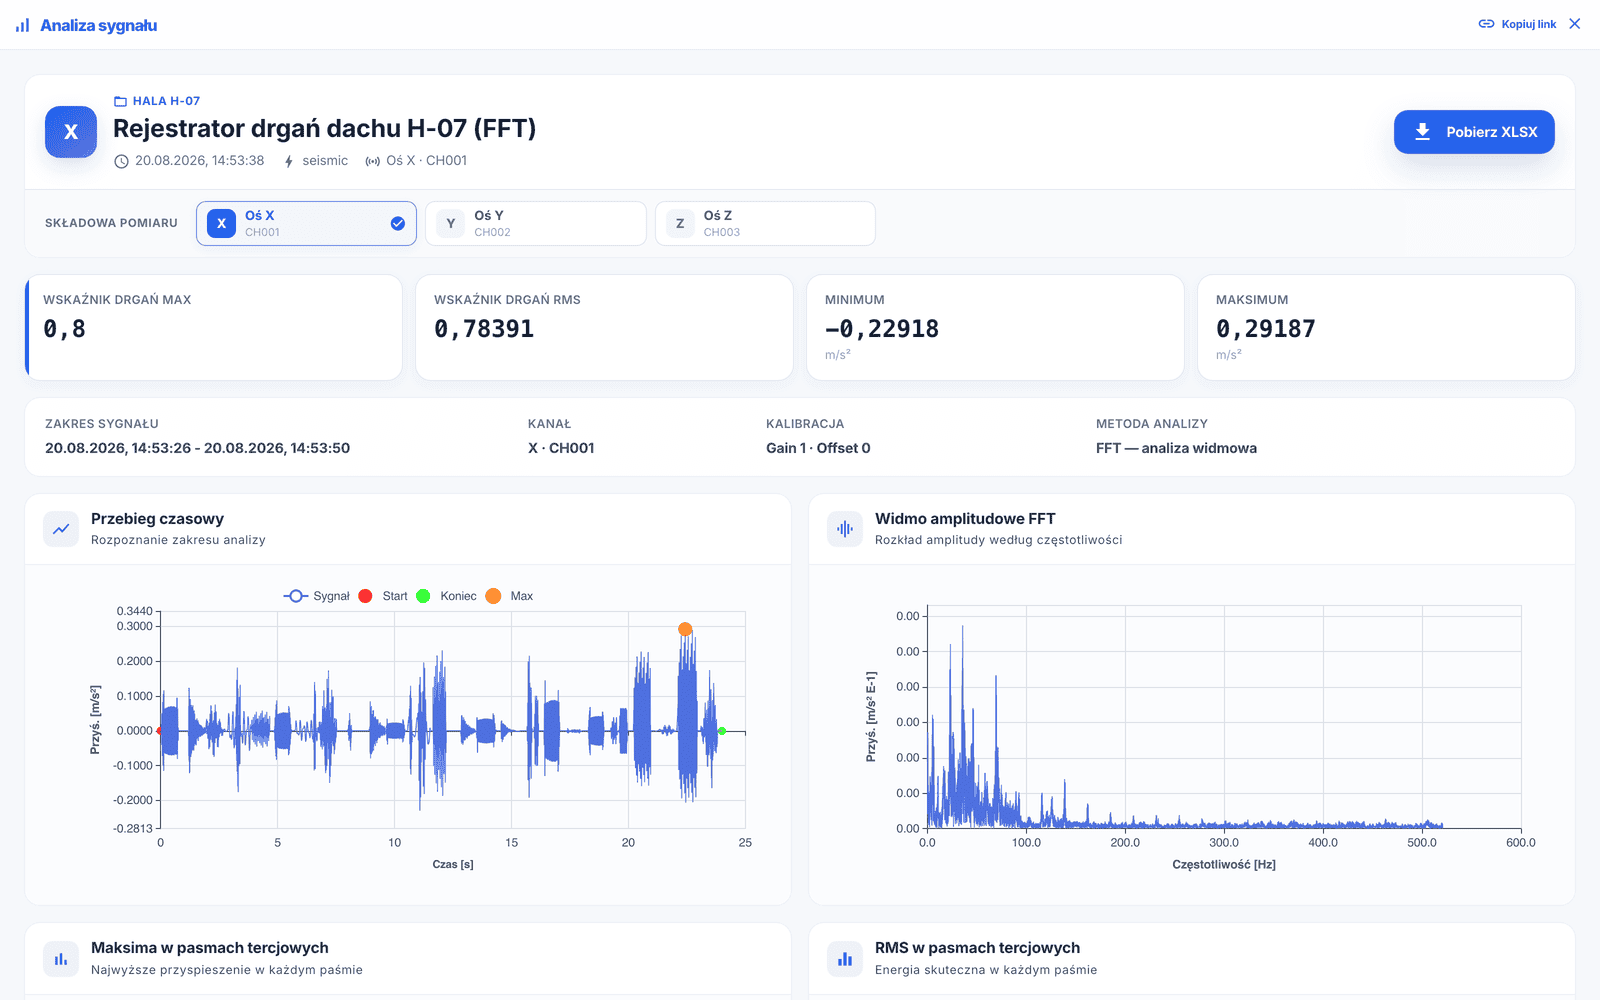
A dynamic event broken down into bands
The time waveform, the FFT spectrum and the third-octave RMS and MAX bars for a single event. The result of the analysis can be downloaded as a spreadsheet with charts.
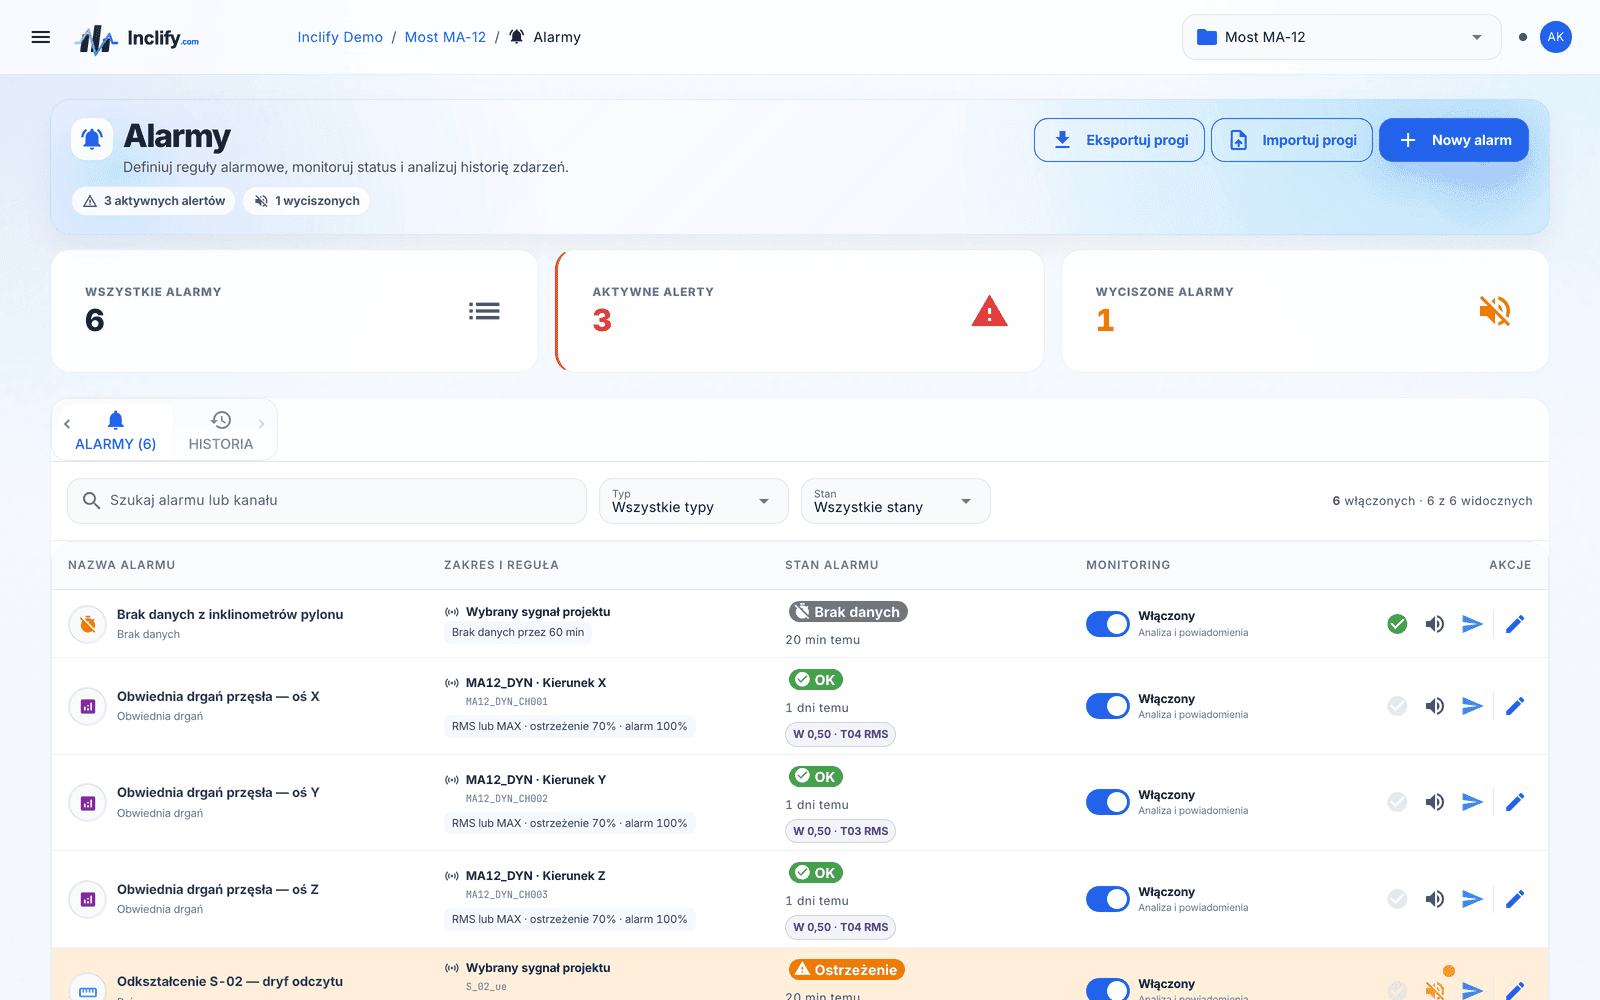
Threshold state and event history
Threshold, missing-data and dynamic alarms in one place — with acknowledgement, muting for a set time and the full history: who did what and when.
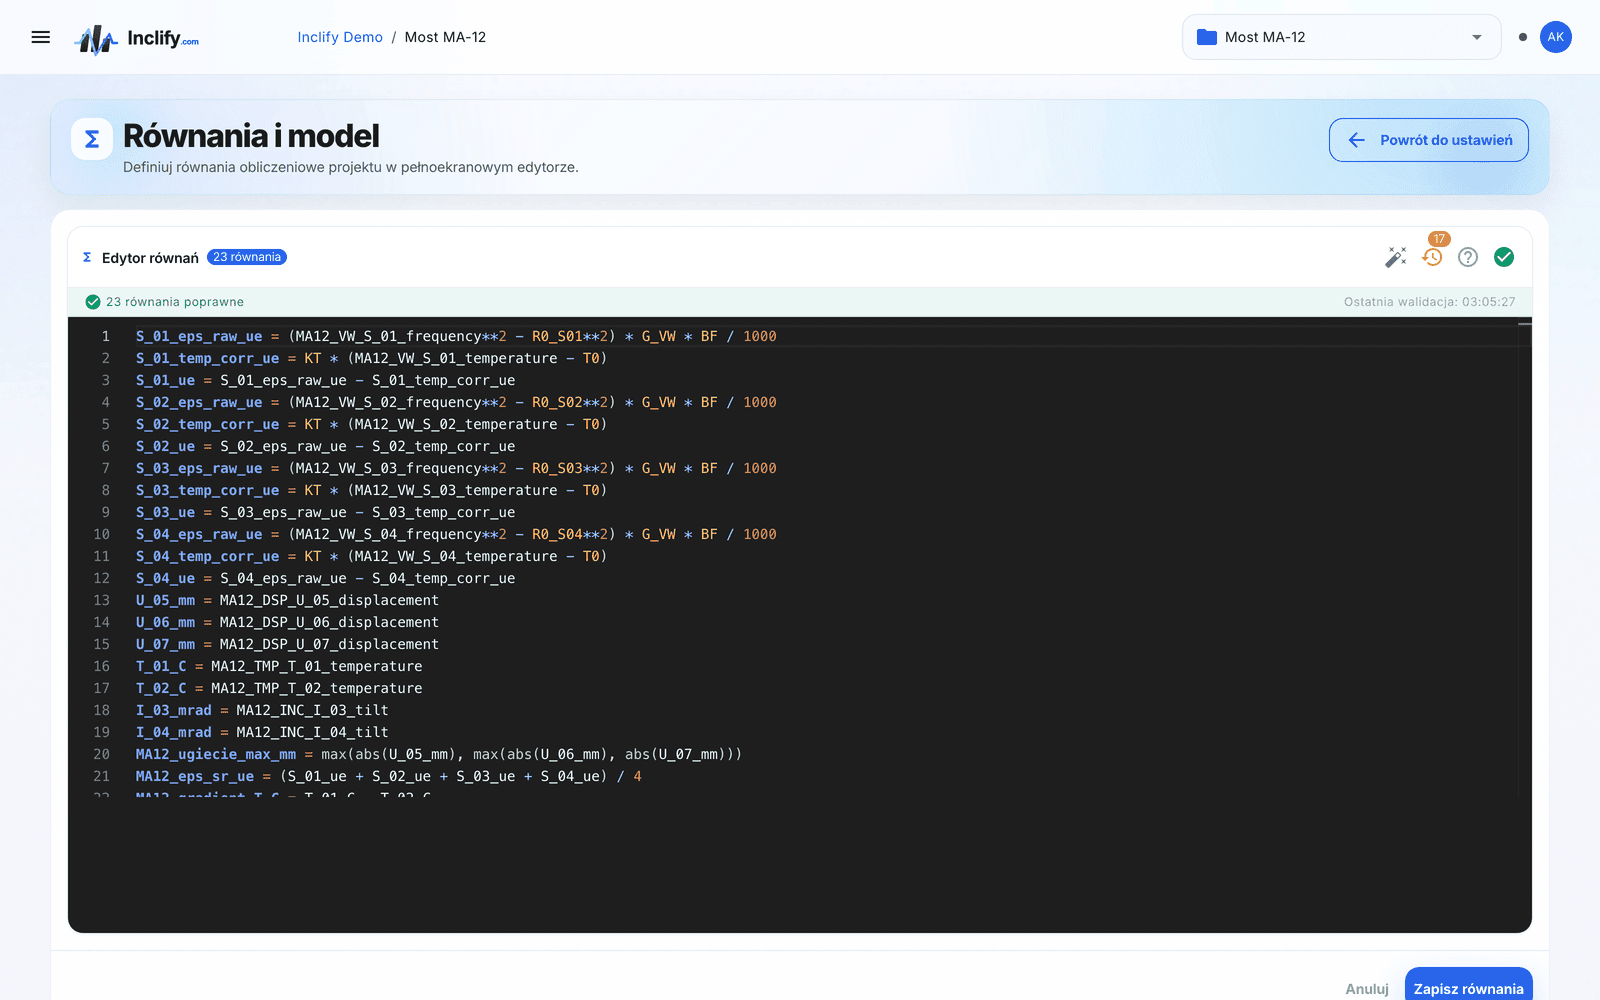
Your formulas, not our assumptions
A full-screen equation editor with variable hints and live validation. Changing a formula or the zero reading recalculates the channel automatically.
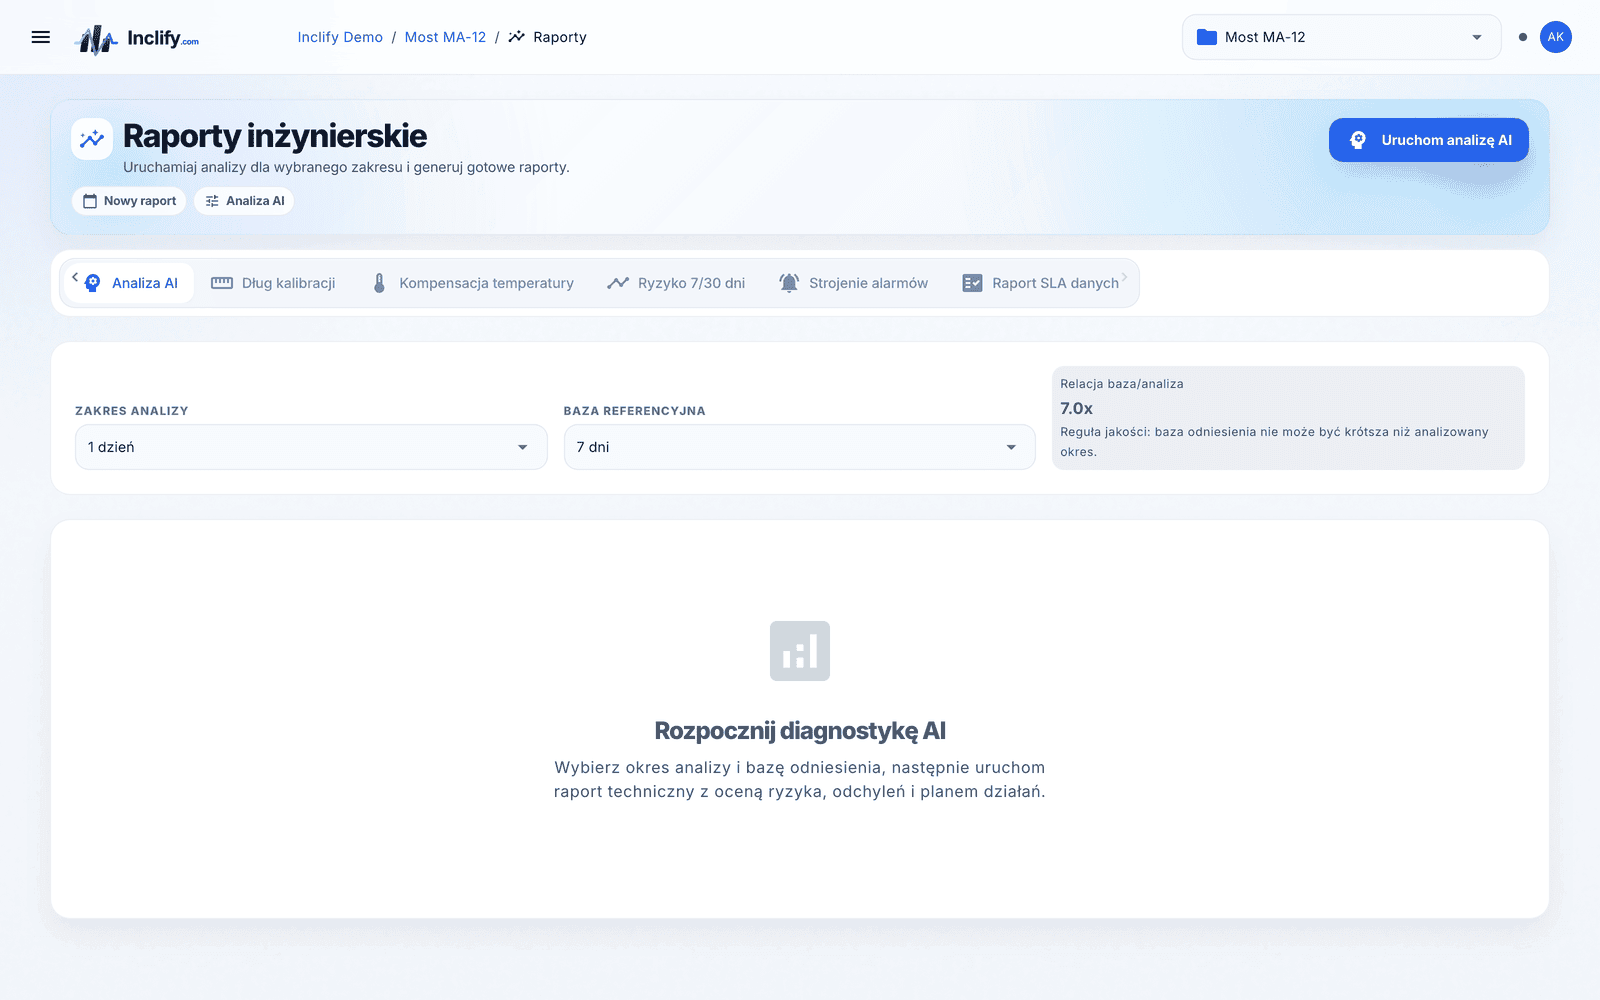
Answers to maintenance questions
Calibration debt, temperature compensation, 7 and 30 day risk, alarm tuning, the data SLA report and an analysis with a written description.
Three things that are easier to show than to describe
Alarm and acknowledgement
A threshold crossed, a notification, an acknowledgement by the engineer — all of it stays in the alarm history.
Narrowing the time window
From thirty days you go down to seven — the daily cycle stops being noise and becomes readable.
Arranging the dashboard
Edit mode: you drag the widgets and set their width separately for each screen size.
Would you rather see it on your own structure?
Book a 30-minute call with an engineer. We will walk through the platform live and advise what to measure at your site and how.