Inclinometers — measuring the tilt of structures
Tilt is one of the earliest and least ambiguous signals that a structure or the ground has started to move. Our name is no accident: Inclify grew out of automated inclinometer measurements — today the platform collects tilt readings every 15 min by default, or more often, watches the thresholds and raises the alarm before a deviation becomes a problem.
What an inclinometer actually measures
An inclinometer measures the tilt angle of the element it is mounted on, relative to the vertical defined by gravity. The result is given in milliradians — 1 mrad corresponds roughly to a displacement of 1 mm per metre of structure height.
- Measurement in one or two axes — the full picture of the direction of movement, not just its magnitude
- Baseline reading after installation: we report the change in tilt, not the mounting angle of the sensor
- Calculation equations convert mrad into displacement in mm at a given height
- Temperature measurement in °C alongside tilt — the daily "breathing" of the structure can be told apart from a lasting trend
In-place (chain) inclinometers — the whole borehole on one chart
A single sensor tells you that something has tilted. A chain of in-place inclinometers tells you at what depth. Inclify handles them as a separate measurement type — with the displacement profile computed from the anchor, rather than as a set of unrelated channels.
- Device profile inclinometer_vertical_sin_v1 — a vertical chain recognised by the structure of its data
- Chain nodes with segment lengths; the first node is the anchor, the reference point for the whole profile
- Displacements accumulated upwards from the anchor, with an A / B axis switch
- A summary above the chart: maximum deviation, the depth at which it occurs and the data quality
- A separate marker when the data has stopped being fresh — an empty chart does not pretend that all is quiet on site
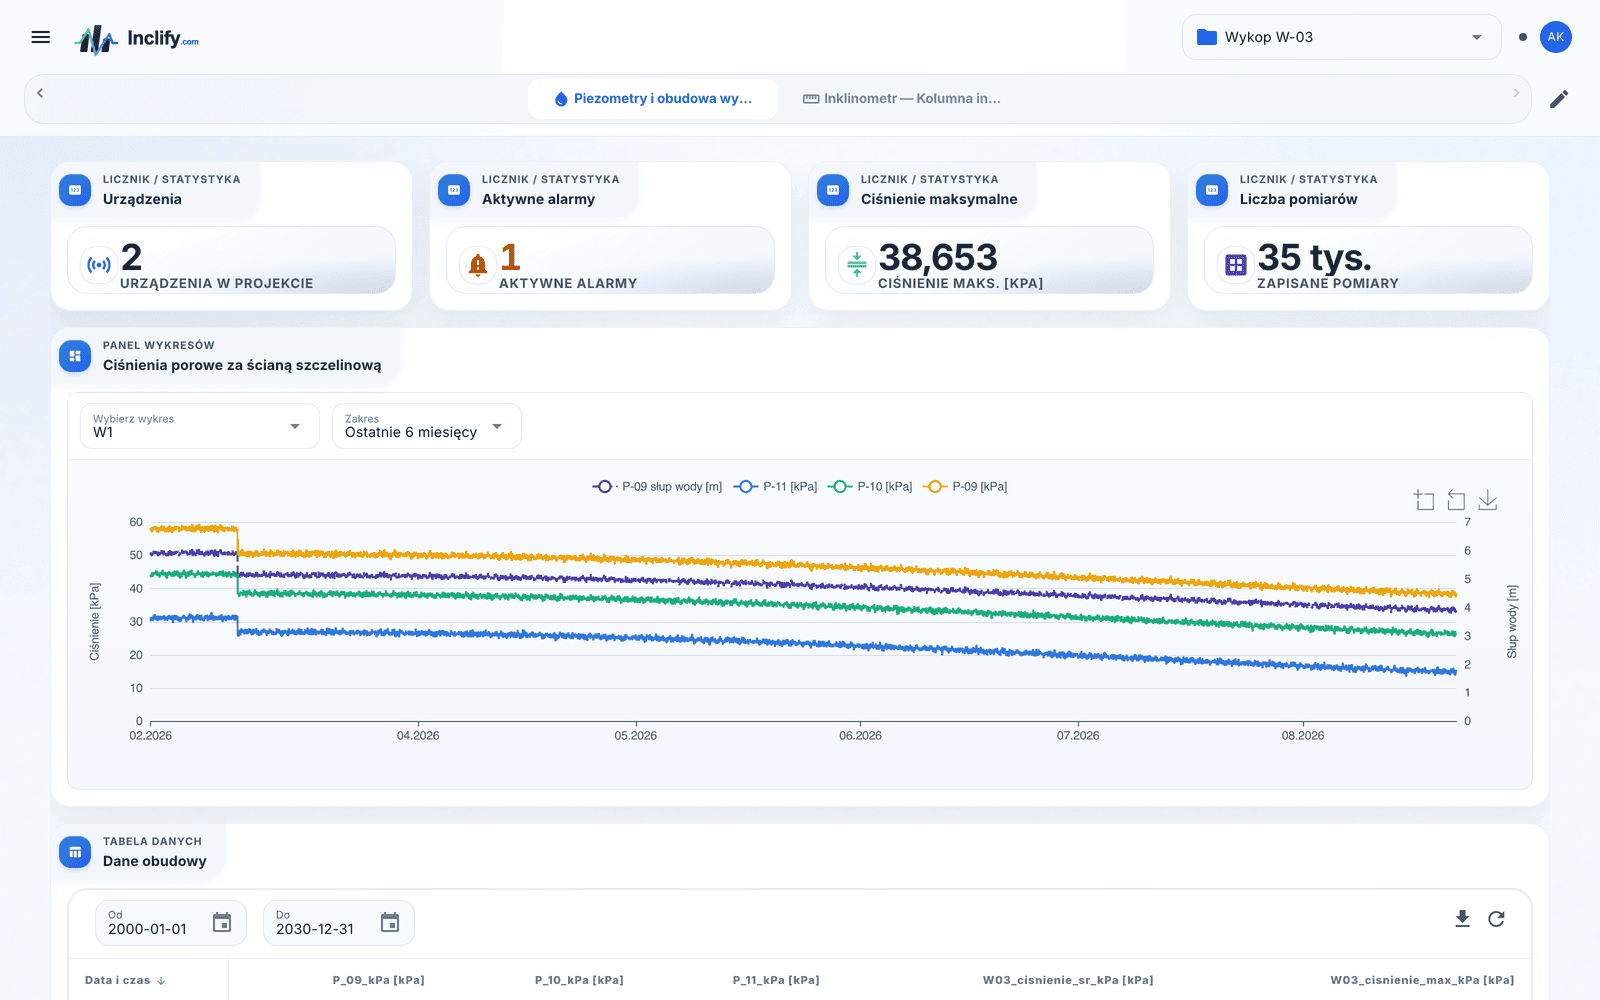
The first valid X/Y/Z frame is enough: the platform creates and activates the chain configuration in version v1 on its own. Nobody fills in a table of nodes by hand.
Along with the configuration, a system dashboard with the vertical profile and the trend is created. The first measurement has somewhere to appear before anyone starts arranging widgets.
Next to the profile — displacement over time, as a separate series for each node of the chain. You see not only where, but also from when the movement accelerated.
Chain configurations are versioned, and their validity periods cannot overlap — the database itself enforces that. For any moment in the history it is clear which version the profile was computed with; its number is shown next to the chart.
The conversions for the chain profile are created as system equations — read-only, so that nobody accidentally changes the geometry under a live chart. You can still write your own equations freely, alongside the generated ones.
Where tilt measurement works hardest
Everywhere the movement of a structure begins with a change of angle — long before it is visible to the naked eye.
Diaphragm walls and excavation support
How the excavation support behaves through the successive stages of digging — the deflection of the wall visible on the chart after every stage of the works.
Columns, pylons and masts
Deflection of tall structures under wind, ice and solar radiation — the lasting trend separated from the daily cycle.
Buildings next to construction works
Structures within the zone of influence of excavations and tunnels: continuous recording of tilt is documentation that settles disputes about the impact of the works.
Slopes and hillsides
Tilt in the ground and on retaining structures indicates slope movement — with thresholds on both the value and the rate of change, especially after rainfall.
Periodic measurement or automated monitoring?
A surveyed tilt measurement once a quarter and an automated inclinometer answer different questions. The first tells you how large the change was. The second — when it started and how fast it is progressing.
- A reading once a quarter or after an event — between measurements the structure is "blind"
- The result depends on crew availability, the weather and access to the site
- An exceedance only shows up in the next series — sometimes weeks later
- A handful of points per year will not show whether the movement is accelerating or dying out
- The cost grows with every additional measurement series
- Readings every 15 min by default, or more often, 24/7 — on holidays, at night and during a gale
- Unattended: no site visits, no scaffolding, no closing the structure for the duration of the measurement
- A threshold exceedance means an SMS, e-mail and push alert in real time
- Trend and rate of change on a chart — a basis for decisions, not a figure in a table
- A fixed, predictable annual cost — plans start at PLN 9,500 net per year
From a reading in mrad to an engineer's decision
The sensor is only the beginning. The value is created in the platform: thresholds, alerts, history and documentation — for every inclinometer on the project in one place, next to the rest of the more than 40 sensor types.
- Warning and alarm thresholds on every channel plus no-data supervision
- Your own calculation equations: mrad → mm conversions, compensations, relative values
- Integration with existing data loggers — we connect the inclinometers you already have on site
- Audit trail and project log: every change to a threshold or a baseline with its full history
- CSV/XLSX exports for expert opinions, inspections and your own analyses
Measure the tilt of your structure
Describe the structure — a diaphragm wall, a mast, a building next to construction works or a slope — and we will propose an inclinometer layout, thresholds and a quote.