Structural vibration analysis — from waveform to threshold.
A dynamic event lasts seconds. Assessing that event in a spreadsheet can take half a day. Inclify takes the waveform from the logger, computes the spectrum and the one-third-octave bands, compares the result with the threshold envelope and closes the case with an alarm or an entry in the history — with no manual processing.
What happens after an event
Six steps between a threshold being exceeded on the device and an entry in the alarm history. All of them automatic.
The device triggers a recording
A trigger threshold being exceeded on the logger opens an event. The platform receives it with its full time context: device, channel, trigger timestamp.
Pre-trigger and post-trigger
The logger adds to the waveform a section from before the trigger and after it. It is the pre-trigger buffer that decides whether you see the start of the phenomenon or only its effect.
The waveform arrives in fragments
The full waveform reaches the platform in chunks, staged on a persistent volume. The event keeps the status “collecting” until the last chunk — only a complete set moves on.
The engine computes outside PHP
The complete waveform goes through the selected processing profile. The calculations run in a native extension based on FFTW — not in the application code.
Comparison with the envelope
The one-third-octave results are compared with reference values band by band. The assessment comes down to a single number — the worst ratio across the whole spectrum.
State, notification, history
Exceeding the warning or alarm coefficient changes the alarm state and triggers a notification. The event stays in the history with a link to the specific waveform.
Two analysis profiles, one input waveform
You choose the profile deliberately — each has different requirements for the signal and answers the question “how much vibration was there in this band” differently.
The fft_v1 profile
The classic spectral route: a Fourier transform of the waveform and an amplitude spectrum from which the one-third-octave values are derived.
- An FFT amplitude spectrum of the entire recorded waveform
- One-third-octave values in two forms: RMS and MAX
- No additional conditions on the length of the pre-trigger
The iir_butterworth_v1 profile
Band filtering instead of reading from the spectrum: the signal passes through a set of filters and the result is computed in the time domain, separately for each band.
- 21 fixed one-third-octave bands over 1–100 Hz
- A fourth-order Butterworth filter implemented as a cascade of second-order sections (SOS)
- The waveform is filtered twice — forward and backward
The Butterworth profile requires a signal sampled above this value. Below it, the highest one-third-octave bands would have no coverage in the data.
The filters need a stretch of signal for their response to settle. A shorter buffer before the trigger disqualifies the waveform for this profile.
Transforms and filtering are computed in a native extension rather than in PHP — which is why long waveforms with a high sampling rate do not block the platform.
After a profile change the whole event history of the project can be recomputed. The results are produced alongside the existing ones and published atomically — the panel never shows a half-finished state.
A threshold is not one number, it is an envelope
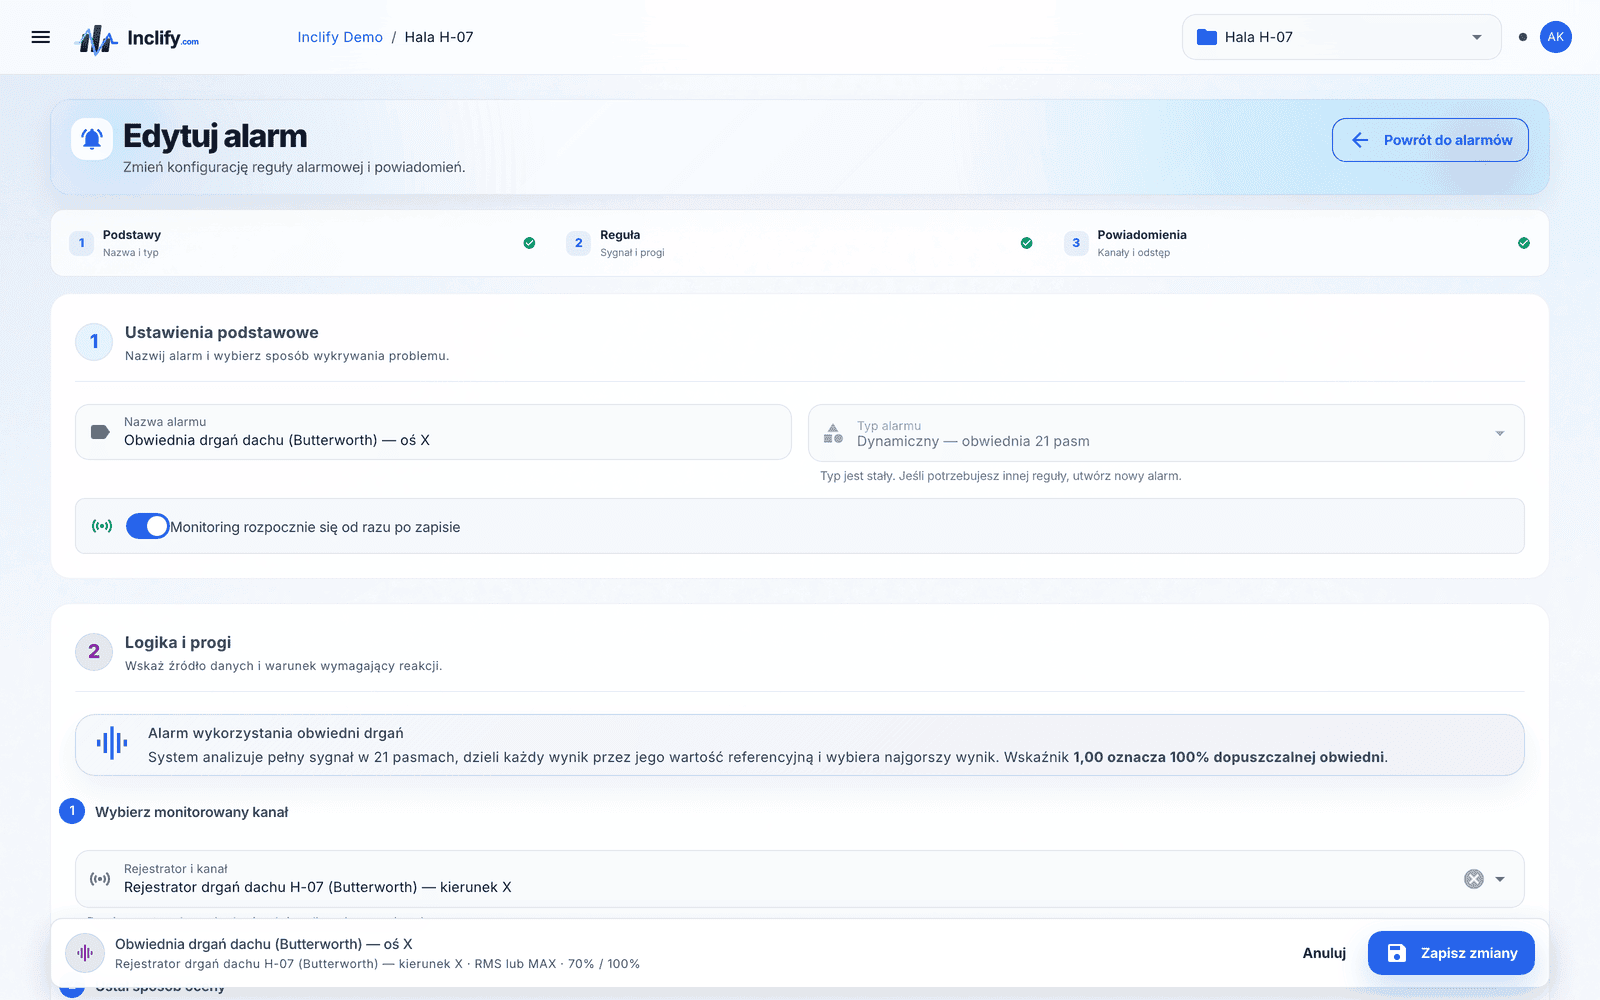
A single limit value for the whole spectrum either lets through what it should stop or raises an alarm at every passing vehicle. That is why the dynamic alarm in Inclify works on an envelope of 21 one-third-octave bands — the normalized_ratio_v2 model.
- A reference value defined separately for each of the 21 bands
- Event assessment reduced to a single indicator: W = max(value / reference)
- A shared warning and alarm coefficient across the whole envelope — you change the shape of the threshold in one place
- Individual bands can be excluded from the assessment when a constant, known source of vibration lives in them on site
- Assessment mode of your choice: RMS, MAX or both at once
Thresholds from SHMmonitor come in as a file
You import and export dynamic thresholds in a CSV format compatible with SHMmonitor — 85 columns, ; separator. Nobody retypes an envelope by hand.
Preview before saving
The import first shows exactly what will change (a dry run), and the save is applied in full or not at all. A file with a typo does not leave half the thresholds changed behind it.
What you get after every event
The analysis result is ready for engineering assessment and for passing on — without moving data between tools.
Event analysis view
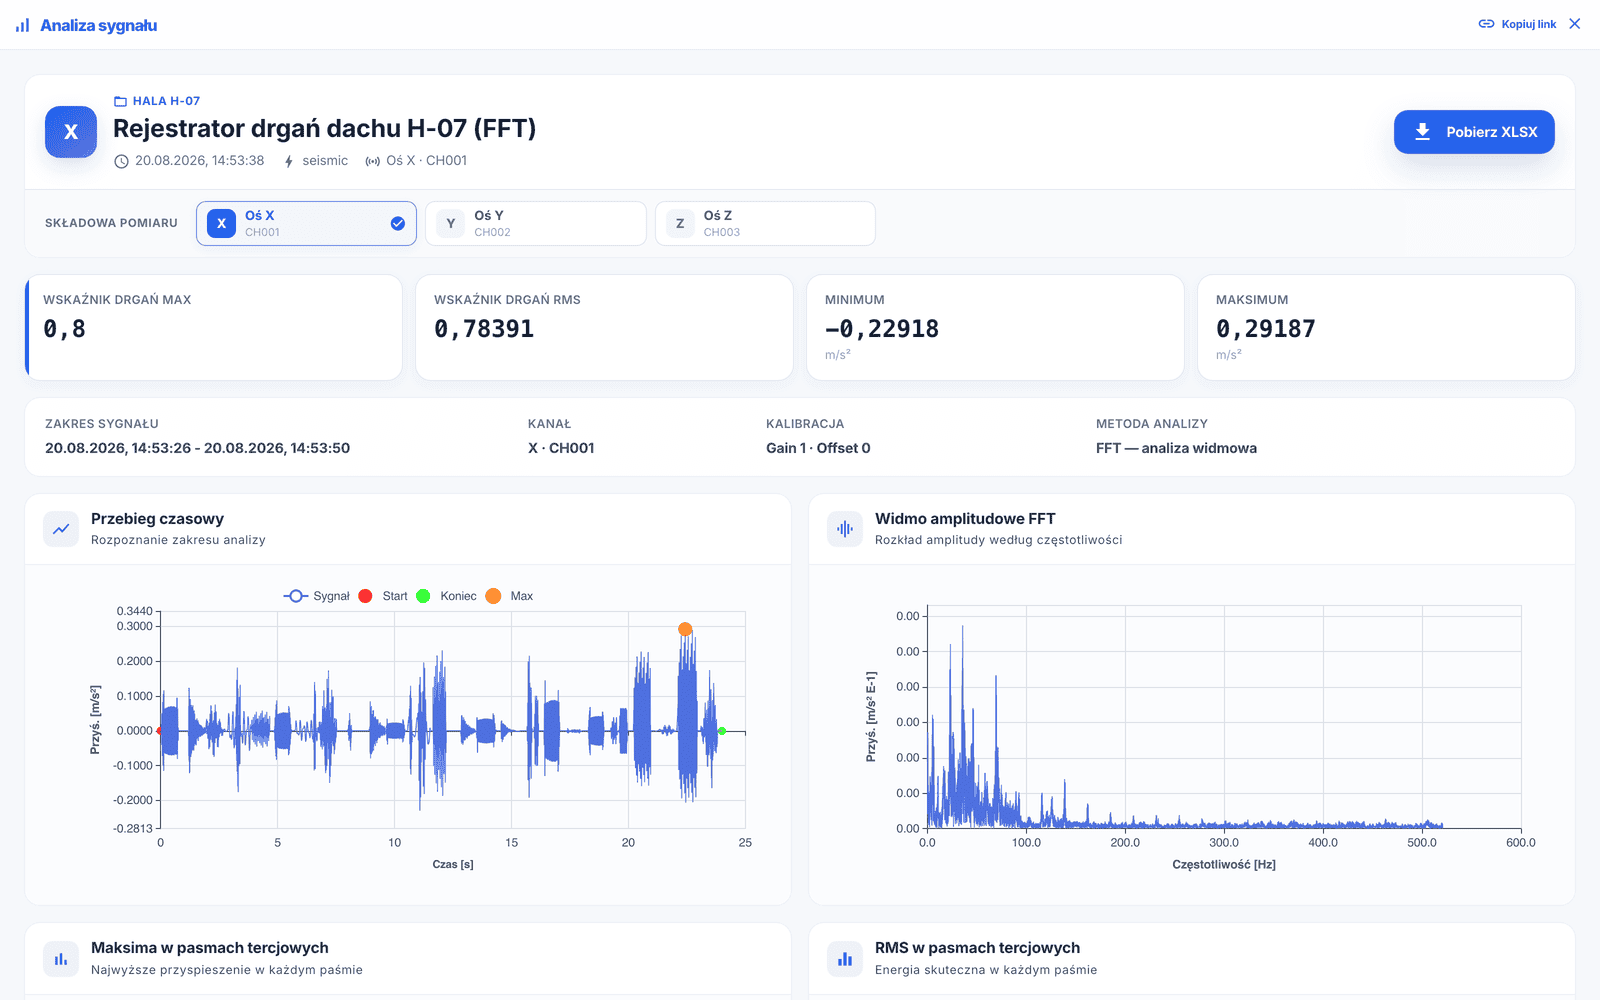
- The time waveform and the spectrum of the same event side by side
- One-third-octave bars in two forms: MAX and RMS
- An X / Y / Z axis selector without reloading the view
- VR MAX and VR RMS metrics above the charts
A result you can pass on
- XLSX export with charts — ready to attach
- Copying a link to a specific event: the other person opens exactly the same view
- Events available together with the rest of the project data, in the same panel
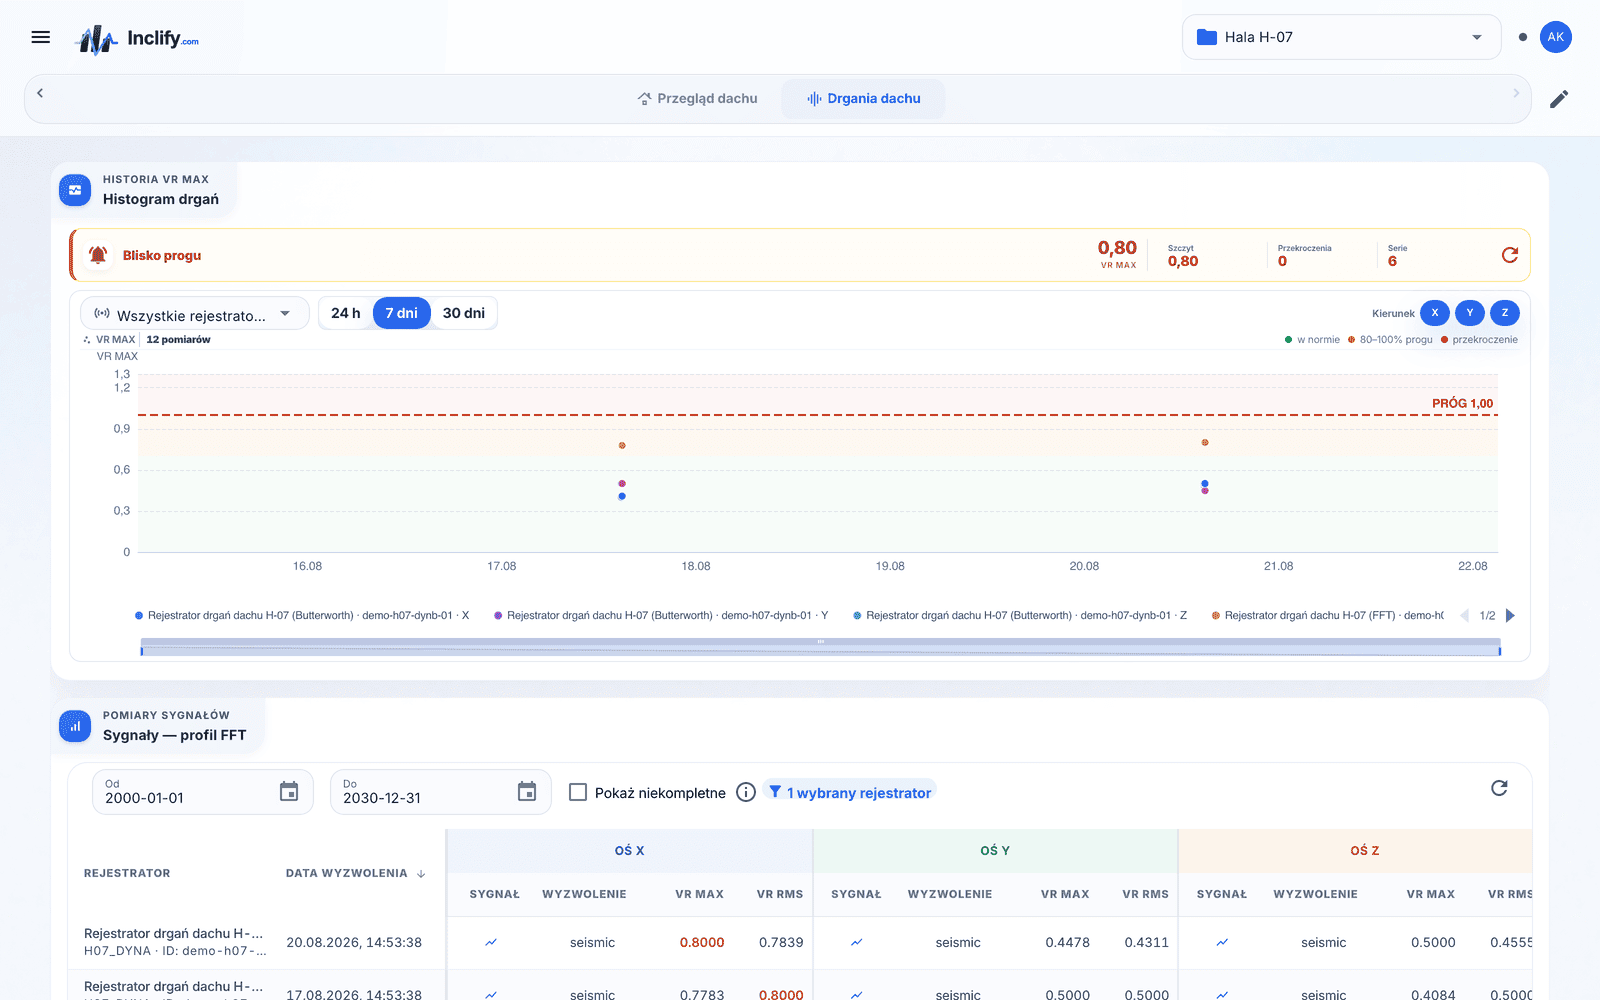
VR MAX histogram
- The distribution of events over a 24 h, 7 d or 30 d window
- A summary of the threshold status under the histogram — how many events there were and where they sit against the envelope
- An answer to the question “was this an exception or everyday life” without going through the list
The settings that decide the quality of the result
The analysis is only as good as the waveform it receives. The recording parameters are set in the platform, on the channel.
Set per channel — it determines how high a band the analysis reaches and whether the waveform qualifies for the Butterworth profile.
The length of the recording before and after the trigger. The pre-trigger is the only way to see what preceded the event.
Gain calibrated separately for the X, Y and Z axes — the results stay in physical units, not in transducer counts.
A change of profile, threshold or calibration goes into the audit trail: who, what, when and to which value. An analysis result can be tied back to the configuration it was produced on.
Vibration is one of the project's channels
Sensors and acquisition
MEMS and piezoelectric accelerometers alongside static sensors — three classes of data: recurring measurements, events and full waveforms.
Sensors for structural monitoring →Analytics and alerts
Calculation equations, reference measurements, warning and alarm thresholds and the full alarm life cycle with notifications.
Monitoring data analysis →The whole platform
From the sensor, through calculations and thresholds, to dashboards, alerts and an audit trail — one system for the static and dynamic behaviour of the site.
Platform overview →Bring one waveform
During the demo we will run your event through both analysis profiles and show what the assessment on the one-third-octave band envelope looks like — on real data, not on slides.