Sensors for structural monitoring. Every technology, one platform.
Vibrating wire, MEMS, inductive, piezoelectric or electrical resistance — Inclify accepts data from more than 40 sensor types and from data loggers already in place. We match the measurement technology to the structure, not the other way round.
The right sensor for the right job
There is no single technology that is good for everything. There is, however, a platform that understands each of them.
The standard for static measurements: 20+ years of stability and immunity to electromagnetic interference. Strain gauges, piezometers, crack meters.
A high sampling rate for dynamic measurements: vibration, accelerations, tilt. The basis for FFT analysis of signals from the structure.
Displacement measured without physical contact with the element — where mounting on the structure is impossible or inadvisable.
Fast-changing phenomena: impacts, vehicle crossings, machinery in operation. Full signal waveforms recorded for further spectral analysis.
A proven, affordable technology where a dense grid of measurement points matters more than decades of stability.
Strain µε, deflection mm, tilt mrad, stress, pore pressure kPa, temperature °C.
Four routes for data into the platform
A new installation or a site with loggers installed years ago — the data ends up in the same, consistent measurement model.
REST API
Direct feed from hubs and loggers in near real time. The standard route for new installations.
CSV / XLSX import
Upload of measurement files, including historical ones. A site's history held in spreadsheets becomes part of continuous monitoring.
FTP
Automatic pickup of files dropped onto a server by loggers — with no change to the hardware configuration in the field.
Existing data loggers
We connect loggers already working on site. The investment in measurement hardware stays — what changes is what happens to the data.
Three classes of data, one order of time
Static and dynamic data need different treatment — the platform tells them apart from the moment a measurement is accepted.
Static data
Recurring readings every 15 min by default, or more often: strain, tilt, pore pressure, temperature. The basis for long-term trends and safety thresholds.
Events (trigger)
Recording triggered by a threshold being exceeded on the device: an impact, a crossing, a shock. The event reaches the platform with its full time context.
Full waveforms
Raw vibration signals from accelerometers, analysed automatically by FFT: RMS, peak values, frequency spectrum.
Loggers report in different time zones and time formats. The platform normalises the timestamps so that charts from several devices refer to the same moment.
A logger clock that slowly runs away can falsify correlations between channels. Inclify detects the drift and flags it before it spoils the analysis.
Every frame recorded
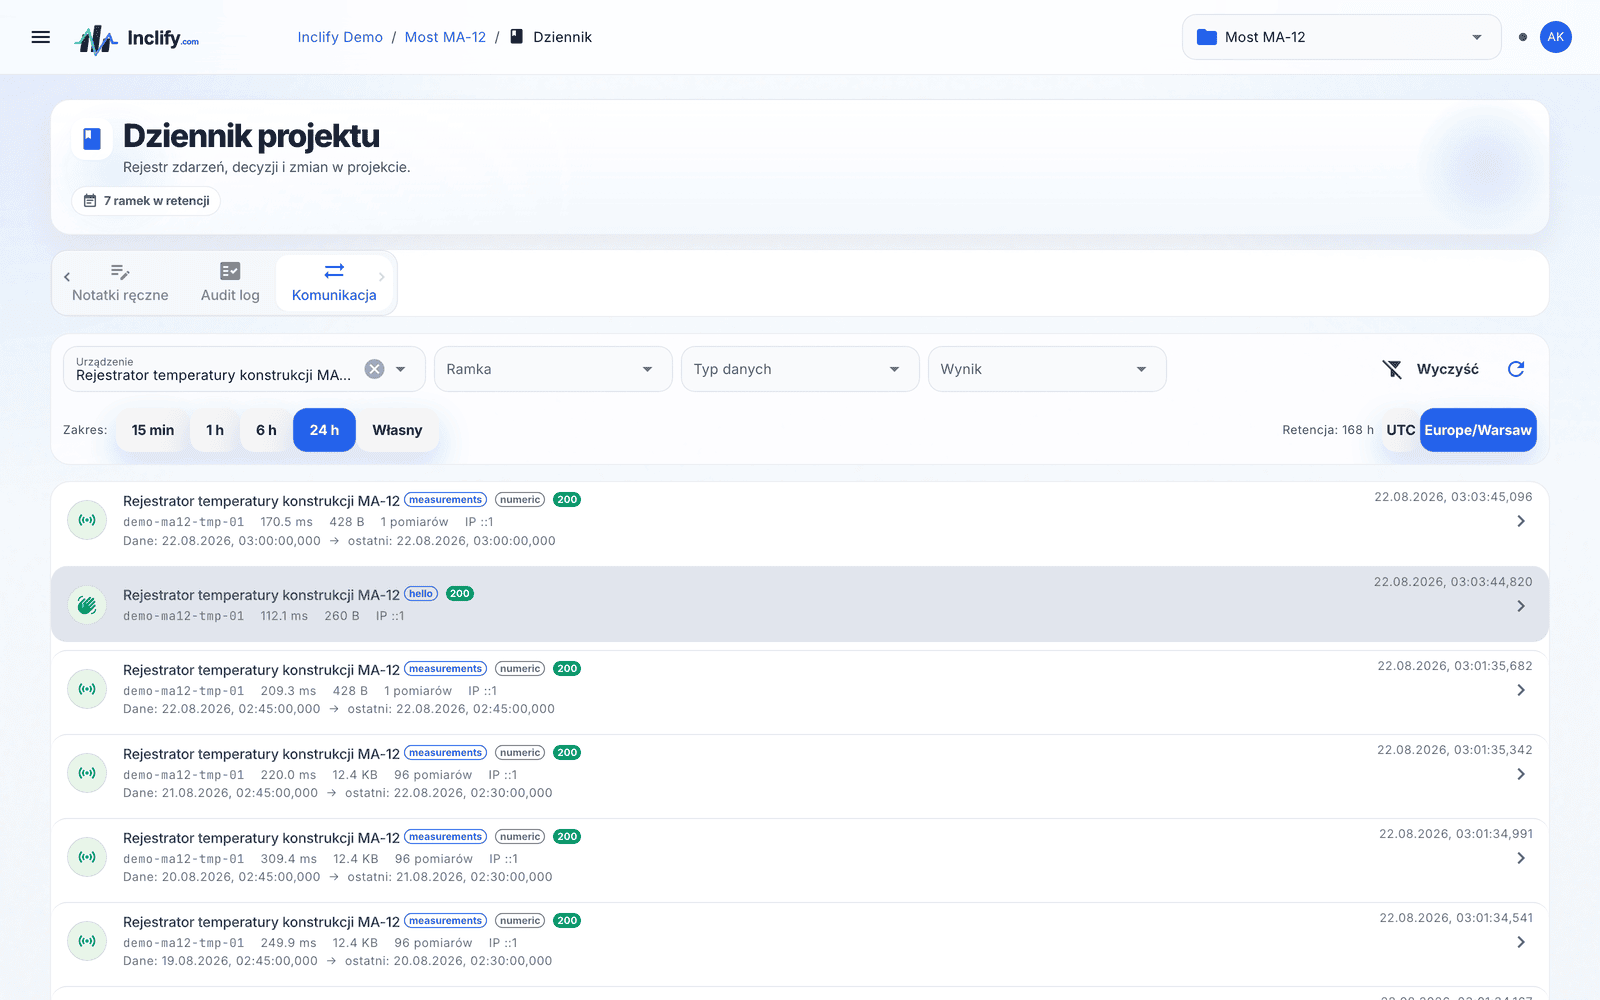
When a reading looks odd, the first question is whether it is the structure or the transmission. The answer is in the archive — every recognised exchange with a logger lands in the database exactly as it arrived.
- The raw frame preserved in full — viewable in the panel and downloadable for your own analysis
- Stored compressed with gzip and a SHA-256 checksum: you can see the content has not changed since it was accepted
- Each frame carries the range of measurements it produced — you immediately know exactly what it brought in
- Retention driven by configuration, 7 days by default — a diagnostic archive, not a second measurement database
Device clock under control
The platform checks the time reported by the logger and flags drift before it pulls apart the correlations between channels.
One identifier, one device
A duplicated logger identifier is rejected. Two devices claiming the same channel will not mix their data inside a project.
Operation audit log
Who changed what and when, from which IP address and by which method, the value before and after, whether the operation succeeded, plus a summary of the changes. With filtering and export.
Project journal
Entries with the date of the event, a title, a description, a category and a severity. You match a step on a chart with recorded work on site instead of reconstructing it from memory.
Sensor data is only the beginning
Online monitoring
Dashboards with more than 35 widget types, real-time updates and the full picture of the site on one screen.
Online structural monitoring →Analytics and alerts
Custom calculation equations, reference measurements, warning and alarm thresholds, plus SMS, e-mail and push notifications.
Monitoring data analysis →The whole platform
From the sensor, through the calculations, to alerts and reports — see how the Inclify modules add up to a single measurement system.
Platform overview →Already have sensors on site?
We will check whether they can be connected to Inclify — 15 years of the team's work in structural monitoring, from stadiums to navigation locks, has taught us how to talk to any logger.