Analysis of structural monitoring data — from equation to alert.
A raw sensor reading is not yet information. Inclify converts channels with your own equations against a reference measurement, watches warning and alarm thresholds — and notifies the right people by SMS, e-mail or push.
Your formulas, not our assumptions
Every designer calculates differently. Instead of fixed conversion factors you get an equation engine in which you write down exactly the formula adopted in the monitoring design.
- Custom equations on measurement channels: mathematical functions, statistics, project constants
- A full-screen editor with live validation — a syntax error or a missing dependency is visible before you save
- Results calculated against a reference measurement (baseline) per project and per sensor
- Changing the baseline or the equation means the channel is recalculated automatically
The first stable reading on a channel becomes the zero point — no manual configuration when the project starts.
A reference point from a specific moment — for example before works started nearby, or after a repair was completed.
A reference value entered directly — when the zero is defined by the designer rather than by the measurement history.
Baseline measurements from an earlier system or measurement campaign are uploaded as a file — continuity of reference is preserved.
Three types of alarm, one life cycle
An alarm nobody acknowledged is an alarm that did not work. That is why, on top of the thresholds, the platform supervises the whole handling process.
Threshold
Warning and alarm thresholds on any channel — raw or converted by an equation. Separate levels for the WARNING and ALARM states.
No-data
Supervision of missing data: when a sensor or logger goes quiet, the platform reports it just as seriously as a threshold being exceeded. Silence on a channel is a signal too.
Dynamic (FFT)
Thresholds on vibration analysis results: RMS, peak values and the spectrum. A dynamic event is assessed automatically, not after the fact.
Alarm life cycle
- OK / WARNING / ALARM states visible on dashboards in real time
- Alarm acknowledgement — it is clear who took over the case and when
- Muting for the duration of maintenance work, without switching monitoring off
- A full history of alarm events and a test notification for verifying the configuration
Notification channels
- SMS — reaches people even where there is no data coverage and no app installed
- E-mail — with the event context, to team mailboxes and to the documentation
- Push — immediately on the phone of the people on duty
- Real-time notifications to the people assigned to the project — in line with roles and organisation data isolation
From threshold to closing the case
An alarm in Inclify has a state, a history and an owner. Below is everything that happens between a threshold being exceeded and the channel returning to normal.
Four states, including a separate one for silence on a channel. Missing data does not hide behind the OK state — it is visible as a distinct situation to be handled.
Returning to the OK state requires dropping below the threshold by a defined margin. A channel oscillating around the limit does not generate a series of alarms and clearances.
The evaluation time window is set per alarm — from reacting to a single reading to assessing a channel's behaviour over a whole day.
An alarm can watch the reading straight from the sensor or the value after the calculation equation — depending on which quantity the design treats as the controlled one.
Acknowledgement records who took over the case. Muting has an end date — after it the alarm goes back to work on its own, with nobody having to remember to re-enable it.
A minimum interval between notifications from the same alarm. One event means one message, not several dozen text messages during the night.
Every state change, acknowledgement, muting and notification sent on a single timeline — the material for reviewing an event after the fact.
Everyone chooses their own notification channel, the minimum state they want to be woken for, the projects they subscribe to and the alarms they mute.
Test notification
You verify the configuration with a test message, not with the first real threshold breach. A mistyped number comes to light on the day of deployment.
Evaluation resistant to race conditions
Simultaneous evaluations of the same alarm are serialised by an advisory lock, late results are discarded, and the notification is recorded in the same transaction as the state change. There is no alarm without a notification and no notification without an alarm.
Six reports, six specific questions
A separate tab in the panel and one analysis window for all reports: 1 d, 7 d, 14 d, 30 d or 90 d.
AI analysis
Statistics per variable, the last 24 h compared against a baseline window, detected steps and dead channels — and on top of that a narrative, a list of findings and a ranking of recommendations.
Calibration debt
A score for every channel and a recommended inspection date. Instead of “at some point we should go round the sensors” you get a list in order.
Temperature compensation
Separating the influence of temperature from a genuine change in the behaviour of the structure — on data from the selected window, channel by channel.
7 / 30 day risk
An indicator and a risk level for every channel together with an estimated time to event in days. The basis for setting the order of the work.
Alarm tuning
An estimate of the number of alerts per week before and after a threshold change — and if the numbers add up, you apply the suggested thresholds with one click.
Data SLA
The number of samples against the expected number, the actual reading cadence, the p95 of delays and a list of gaps. A hard basis for a conversation about the condition of the installation.
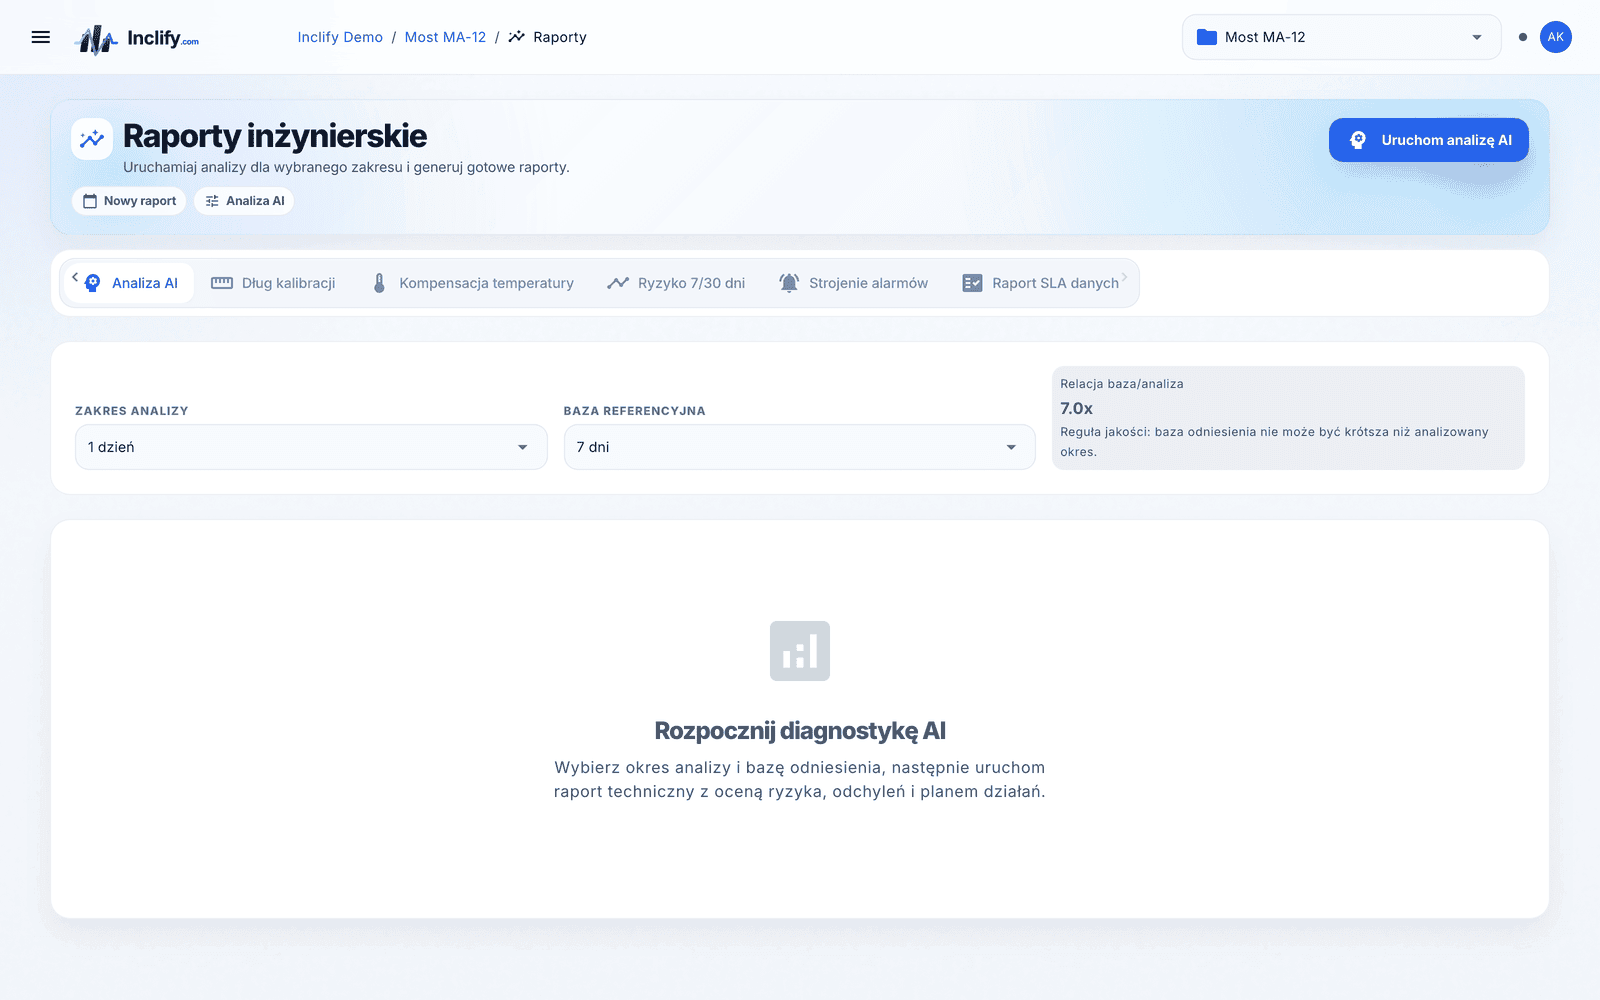
The database does the arithmetic. The model only describes it.
It is worth knowing where the arithmetic ends and the language begins in this report. So we set it out explicitly.
What the database computes
- A query over the table of converted values: statistics separately for each project variable
- The z-score of the last 24 h against a baseline window — 7 d, 1 month, 2 months or 90 d
- Detection of steps in values and of channels that have stopped changing
- An anomaly ranking — it is what decides what the report will talk about at all
What the model writes
- The language model receives anomalies that have already been computed — not raw measurements
- On that basis it produces a narrative, a list of findings and a ranking of recommendations
- Every recommendation has the same structure: action, objective, evidence from the data
- When the model is unavailable the report is still produced — in a deterministic text version, on the same numbers
The report does not replace an engineer's judgement. It shortens the path to the point where that judgement begins.
Analyses that save hours of looking through charts
A set of analyses computed on the project data — factually and repeatably, as support for an engineer's judgement, not as a substitute for it.
An aggregate assessment of the state of the monitoring project based on alarms, data completeness and channel behaviour — one glance instead of a review of every chart.
Readings that depart from a channel's previous behaviour and sensors that have stopped carrying information — flagged automatically, for an engineer to verify.
Separating the influence of temperature °C from a genuine change in the behaviour of the structure — fewer false alarms in heat and frost.
An assessment of channel trends over a 7 and 30 day horizon against the project thresholds — which channels need attention first.
Reading completeness, gaps, delays and transmission stability per channel — a hard basis for a conversation about the condition of the measurement installation.
Every change to a threshold, an equation or a baseline recorded: who, what, when. Analysis results can always be tied back to the configuration they were produced on.
Analytics is only as good as the data it receives
Sensors and acquisition
More than 40 sensor types, readings every 15 min by default, or more often and four data routes: REST, CSV/XLSX, FTP, existing data loggers.
Sensors for structural monitoring →Monitoring and dashboards
More than 35 widget types, real-time updates and CSV/XLSX exports — you see the analysis results where the rest of the data is.
Online structural monitoring →The whole platform
The full data path: from the sensor, through equations and thresholds, to dashboards, alerts and a partitioned database built for billions of records.
Platform overview →Show us your thresholds and equations
During the demo we will configure a sample alarm from the equation through to a test notification — on a real project, not on slides.